Strategic inflection points in ventures
Bold entrepreneurs try to create them. Top-tier venture capitalists can amplify them. Everyone else wants to predict them. Inflection points are imperative.
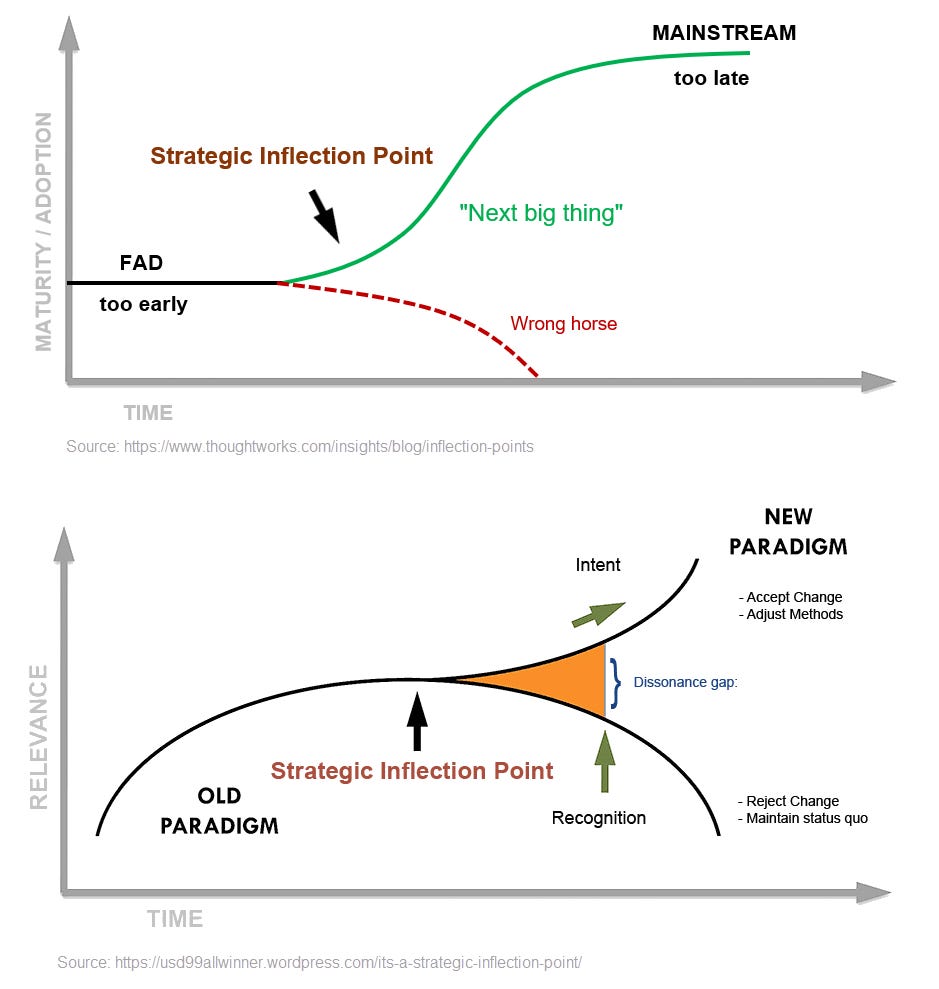
An inflection point has two meanings: mathematical and strategic.
The mathematical term dates back to the first half of the 18th century—used in almost all disciplines where mathematics plays an important role, such as physics, engineering, and economics. The mathematical inflection point means "a point on a curve at which the curvature changes from convex to concave or vice versa" (dictionary.com).
The strategic concept refers to "a critical point at which a major or decisive change occurs." That's what this post is about. The concept was developed in 2006 by Intel co-founder Andrew Grove, "the guy who drove the growth phase of Silicon Valley," as venture capitalist (VC) Earl Floyd Kvamme praised him.
According to Grove:
A strategic inflection point is an event that changes the way we think and act. There is at least one point in the history of any company when it must change, dramatically, to rise to the next level of performance: Miss that point and it starts to decline. Source
Understanding such an event is the very essence of what VCs should do. VCs are there not only to locate promising start-ups and accelerate trends but more importantly to understand strategic inflection points and invest in companies that create new industries. Michael Eisenberg, a partner at Aleph VC, calls them "pre-industries":
Venture capital (as distinct from growth capital) has never been about “the model,” “pulling the model forward,” or accelerating the winner. Venture capital has thrived in uncertainty: uncertain technologies, uncertain market trends and uncertain capital availability. […] “newness” observation certainly applies to new industries, or what I call “pre-industries,” which is either an industry not yet created (think private space exploration before SpaceX) or an existing full-stack industry still unspoiled by tech innovation (think Airbnb, Daisy in building management or Lemonade in insurance). Source
Whether a founder or VC, understanding strategic inflection points is part of your core business.
What it looks like
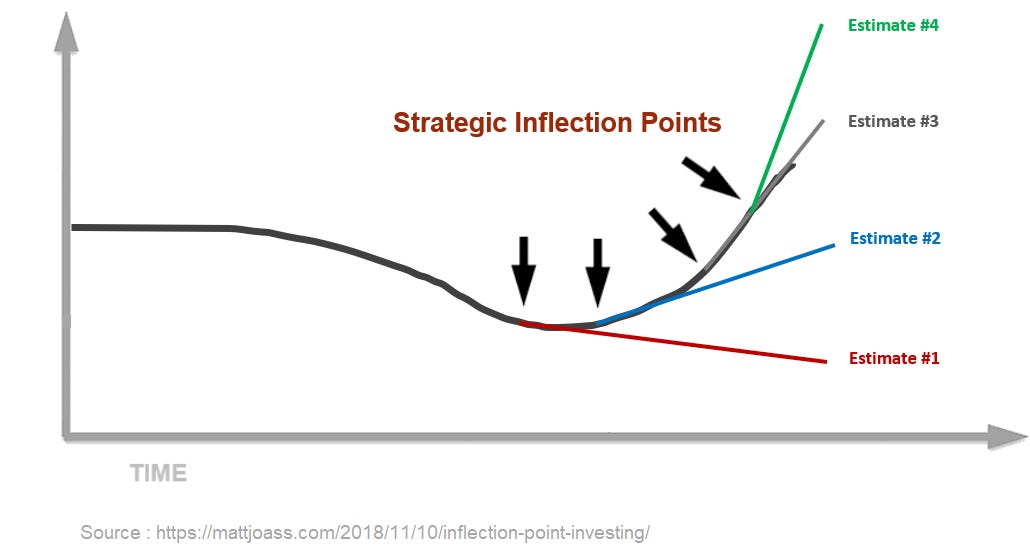
Inflection points can have many different graphical representations (concave-convex, convex-concave, linear change), but they always have two characteristic features:
A history of a few years (say five) that can be used as a reference before the change.
A smooth but lasting deviation from the historical trend that creates a new strategic context.
About anticipation, recognition, and creation
An investor who anticipates an inflection point can make money from it by investing in or selling related assets—before the inflection point occurs. Similarly, entrepreneurs who recognize that an inflection point is imminent can make strategic decisions before competitors do—realigning the business model, entering a new market, changing the organization, and so on. If you cannot anticipate it, try to recognize it.
When the inflection point results from a crisis, it is easy to recognize because the onset of the crisis marks the inflection point. The COVID crisis was so global and profound that it became an obvious inflection point for many industries, a positive one for the digital economy and a negative one for the traditional economy. Both VCs and traditional investors have made a fortune by investing (during COVID) in the technology companies driving the digital economy.
Most of the time, however, inflection points are insidious and can be mistaken for insignificant market fluctuations. For this reason, astute observers focus not so much on the consequences but the causes of inflection: social, industrial, and technological changes. They use one of the following three main approaches to outwit competitors.
1-Analyze the metrics
Metrics analysis is the most systematic and unbiased way to predict inflection points. Metrics can be helpful to detect early and weak signals that go unnoticed by a large audience. Economists use them at different levels: the macro-level (e.g., inflation, unemployment, debt, etc.), the meso-level (e.g., specific industry metrics), or the micro-level (company metrics). This approach requires market and business intelligence at every level.
2-Connect with visionary leaders
Visionary people can predict inflection points without sophisticated analytics. They often use inside information (about an industry or technology) to connect the dots and imagine counter-trend scenarios. These people constantly challenge trends by asking what might change, what could be next, or how to do things differently. Bold entrepreneurs manage to go even beyond by creating ex-nihilo inflections: Tim Berners-Lee (W3C) invented the web, Matthew Mullenweg (WordPress) created a platform that powers 40% of all websites, Steve Jobs (Apple) reinvented the smartphone with the App Store, Marc Benioff (Salesforce) pioneered the SaaS movement and the way we consume software, Mark Zuckerberg (Facebook/Meta) made social networking a global phenomenon and is now working on the Metaverse. Connecting with visionary entrepreneurs is a good way to predict or create inflection points.
3-Follow the money
On the investor side, funds that invest in companies can signal and even amplify inflection points. When investors pour hundreds of millions, and sometimes billions, over a few years in innovative companies like Epic Games ($4.4 billion), Airbnb ($5.8 billion), or Uber ($24.5 billion), their goal is to reinforce existing inflection points and create artificial moats. That is why investment trends change all the time; they follow possible new inflection points. At this moment, food delivery services are getting a lot of attention because investors expect a societal shift in the way people buy and consume food. Crypto funds are flourishing because investors expect cryptocurrencies to become widely adopted shortly. Clean technology is also gaining traction, with leaders promoting it: Bill Gates says climate tech will produce 8 to 10 Teslas, a Google, an Amazon, and a Microsoft. Following the money is a way to find inflection points.
An attempt to model inflection
To model a business inflection, one must model the function that covers the period before and after the inflection. Therefore, the choice of time frame is critical and affects the function. For successful start-ups, inflection can be exponential in the medium term (e.g., five years) but likely polynomial in the longer term (e.g., 20 years). Context and starting point also matter; the function may be more linear for mature firms, while it may be more geometric for early-stage firms.
SaaS use case: a perfect scenario
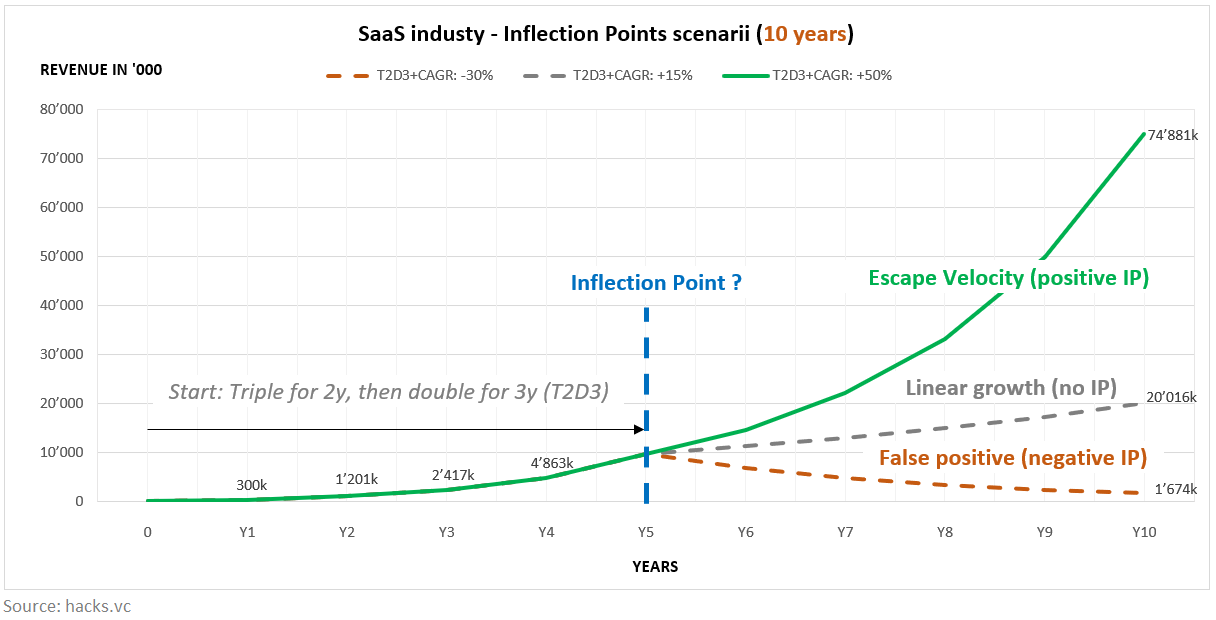
Let us start with a perfect but theoretical scenario for a SaaS start-up. I used the annual revenue metric because it is common for start-ups, and I assumed that the company generated an initial $75,000 in revenue. That's the baseline. Then I applied the T2D3 path coined by Neeraj Agrawal, General Partner at Battery: Triple, triple, then double, double, double. In its fifth year, the start-up is reaching $10 million in revenue. It would be logical to expect a lower growth rate at this stage, as it is quite rare for a company to double every year over a long period. This is the point where an inflection could occur with three possible scenarios:
False-positive: The initial success is not confirmed. The company declines dangerously. Assumption: CAGR −30%
Linear growth: The company continues to grow but at a rate much lower than expected. Assumption: CAGR +15%.
Escape velocity: The company experiences hyper-growth and creates an escape velocity effect. Assumption: CAGR +50%
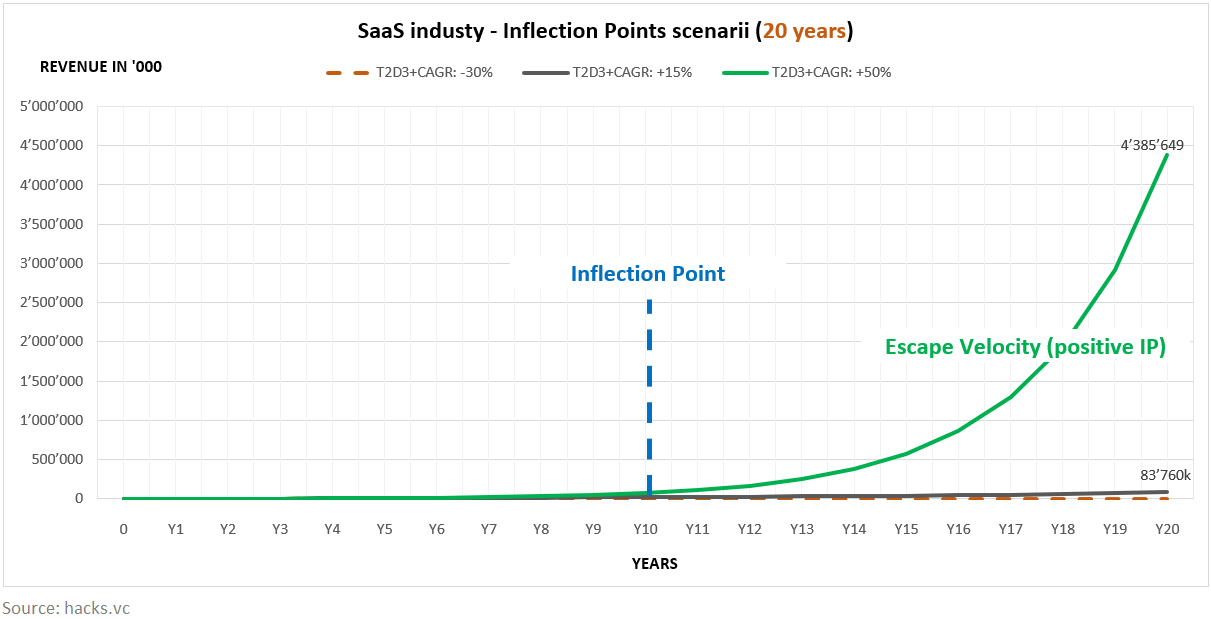
If we create the same graph, but over 20 years (instead of 10), we see the compounding effect of the escape velocity scenario (CAGR +50%). It is so big that the two other scenarios become insignificant. But while this exponential curve looks promising, it is also highly improbable. With time, the company will hardly sustain such a growth rate (market size limitation, new competition, higher marketing costs, etc.).
The Zoom case
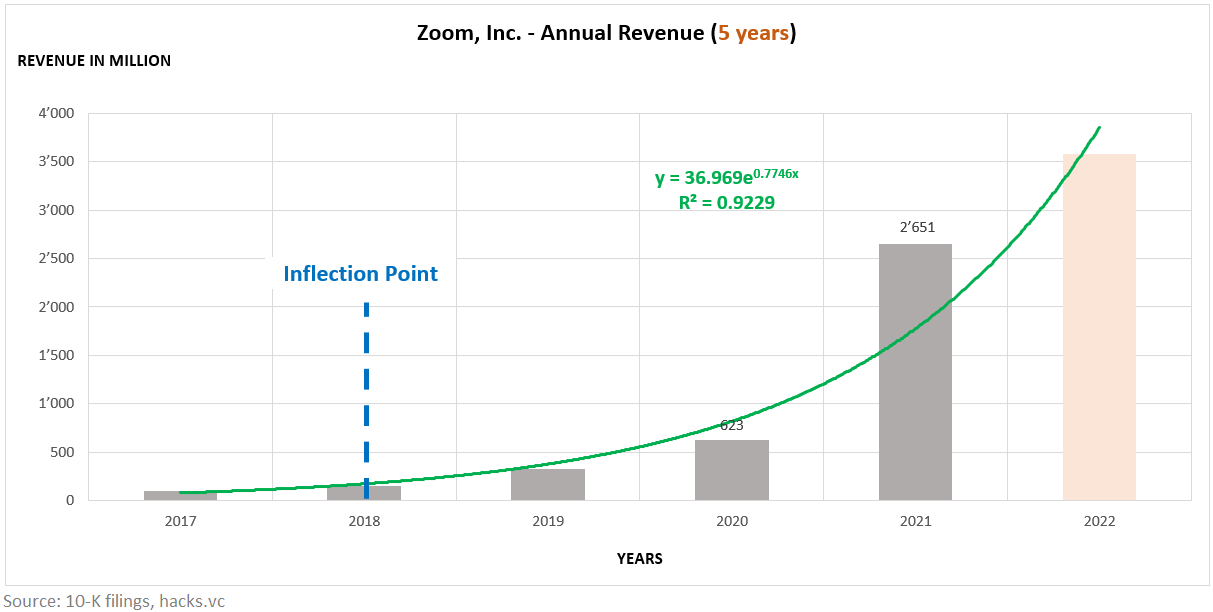
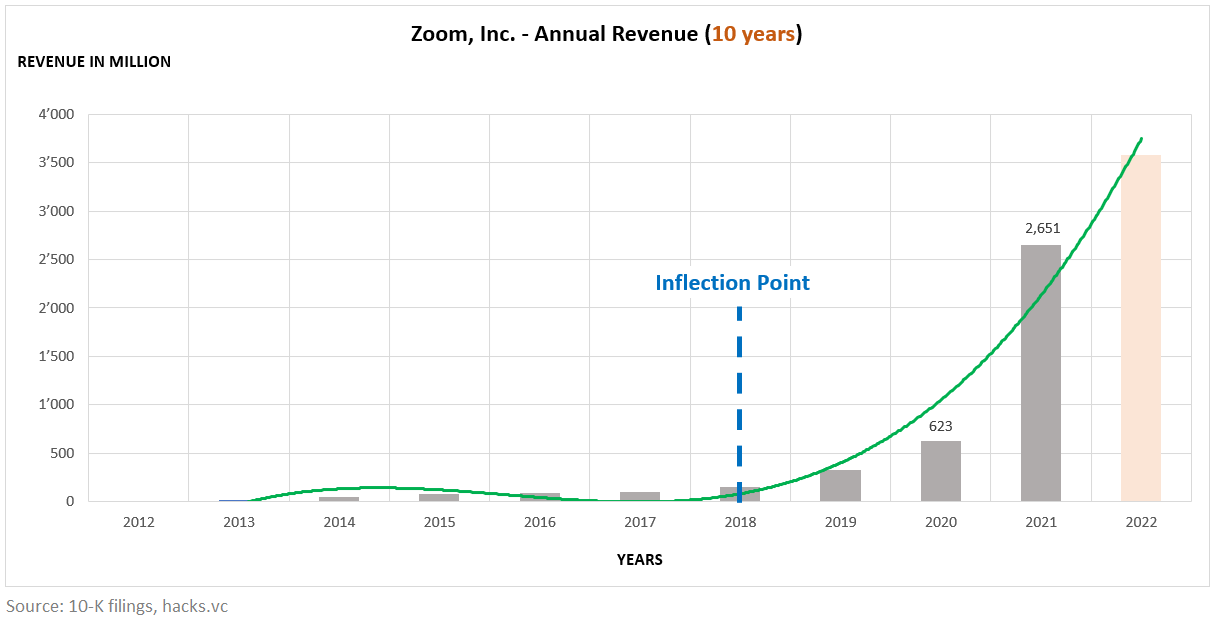
Zoom Video Communications is an excellent example of this exponential growth. Founded in 2011, the company has gone from zero to $2.6 billion in annual revenue in less than ten years. The chart below shows the last five years; we see impressive exponential growth in revenue with an inflection point in 2018/2019 due to the COVID crisis and the global remote work movement. Within this period, an exponential function represents well the growth of the company.
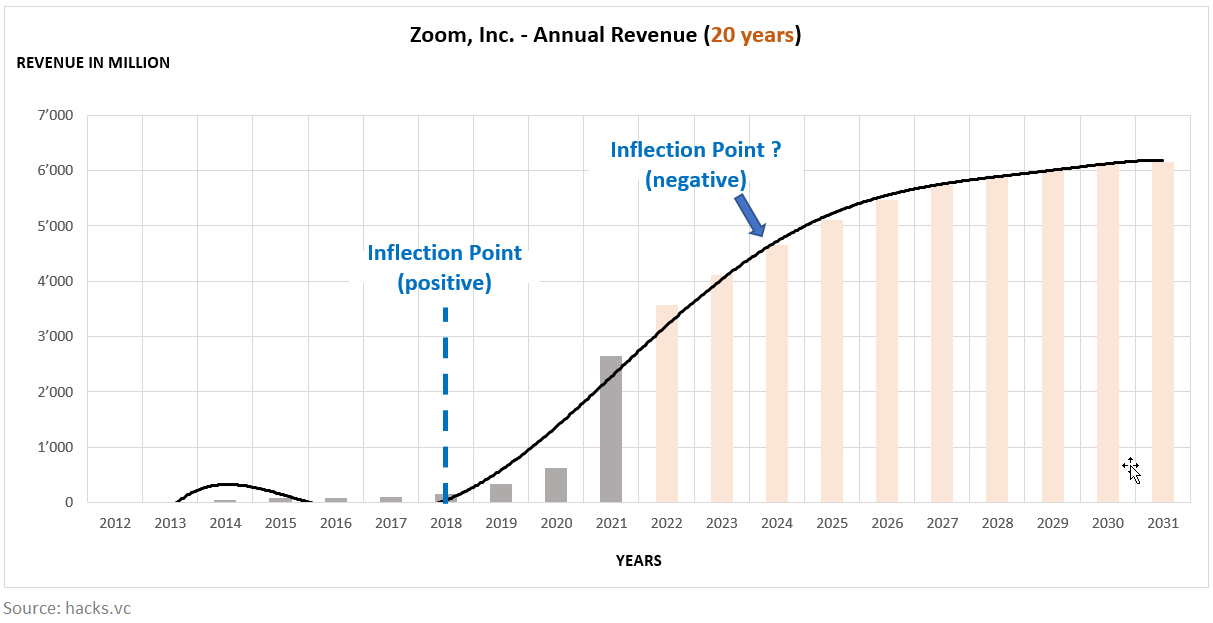
However, unlike our theoretical and perfect scenario, the exponential function will not hold for 20 years. After COVID times, much of the market will have switched to telecommuting, and new competition will have emerged. If the company does not innovate or add something new, it will likely face a negative inflection point with a logarithmic growth from 2022 or 2023.
Generalization
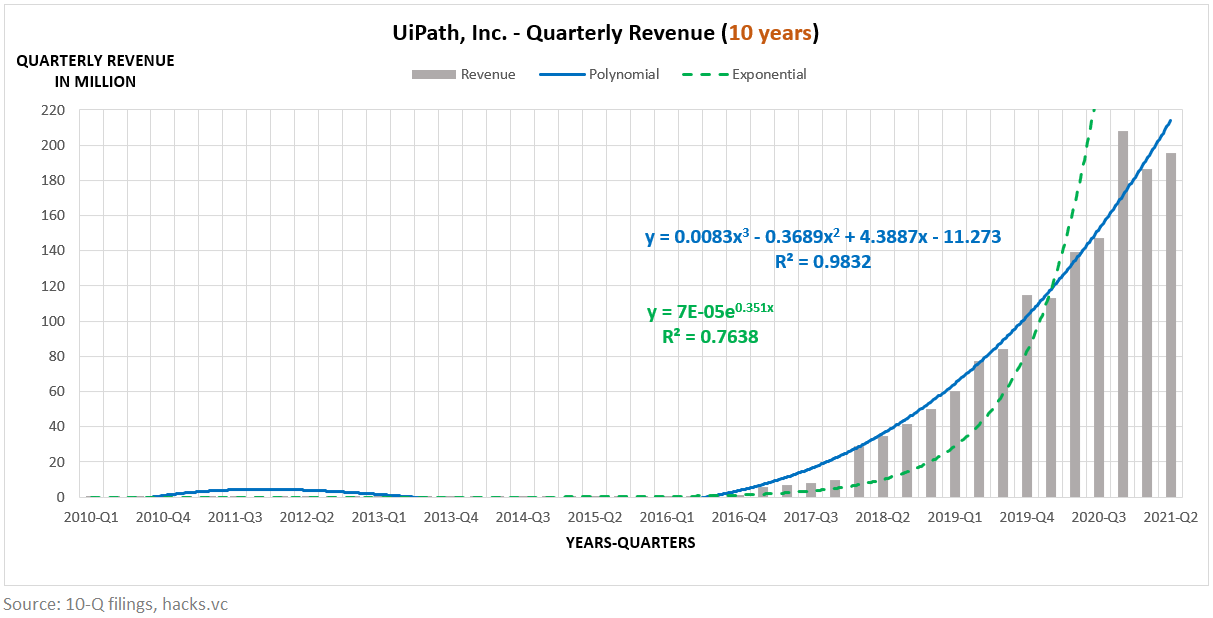
I created similar graphs for two other tech companies: UiPath and Tesla Motors. These graphs show that over ten years, with a baseline near zero, a polynomial function (of order 3) is a better fit than the exponential function in green. A polynomial function is more realistic because a hyper-growth cannot be sustained for too long and each company can face short-term downturns, like Tesla during COVID.
The game
An inflection point is like a game. The first player to identify a possible inflection wins because he or she has the opportunity to optimize his return-risk ratio (more return, less risk, or both). It's like investing when the price is still low or selling when it's still high. In other words, it's an arbitrage game.
An entrepreneur's interest involves selling a positive inflection point to attract investors and better negotiate their share price. An investor's interest involves generating outstanding returns at moderate risk. When the inflection point is positive and is detected early, both can win.


